Dash 2018 conference notes
This is the first attempt by DataDog to produce a branded conference, and they did not manage to avoid some of the rough edges that usually accompany first-time events. However, the organizers’ response to various crises was commendable: they scheduled additional workshops when the existing ones proved to be significantly undersized, promised to refund some of the people who could not enter because of overcapacity, took contact information to follow up with some attendees, and in general hustled to recover in an admirable fashion.
I could not, unfortunately, feel the same admiration about the behavior of the security staff at the venue–their arbitrary enforcement of what I thought were nonsensical rules, on multiple occasions, has reminded me vividly of one of the reasons I never really enjoyed clubbing (this might not be too far-fetched a comparison, since the venue–Spring Studios–has been described as “a model-magnet photo studio with a roof top made to throw parties” by Curbed NY. I can confirm the roof is magnificent.)
The three-track format, in combination with the morning-long keynote, meant the rest of the single-day conference felt like it ended way too soon. I would have felt worse about missing what was going on in the other tracks, but @lizthegrey made it easy to follow what was happening elsewhere by live blogging the event–as long as we were not choosing the same talks!
Conference videos are available.
Keynote
The keynote focused on Datadog’s new features, mostly around log processing and tracing. Given the existing metrics functionality, it appears that Datadog aims to implement the three “pillars of observability” under the same product umbrella and hopes that the tight integration will win over the richer feature sets of established competition in the logging and tracing fields.
On the logging front, the decoupling of log capture and search indexing was interesting. Datadog charges separately for each, and it’s easy to think of some use cases where logs should be captured but they don’t need to be readily available for search by humans or automated monitoring. With ingestion costs at around 1% of indexing costs, as long as the volume of indexed logs is of the same order as the volume of archived logs, archival is essentially free. However, I saw this feature as a nice-to-have at best, and it is the core log indexing and searching functionality that would sell a log management solution to me.
On the tracing front, Datadog said that part of the product does not have the cardinality limitations that the metrics part does. Now if only the same feature could be extended to the metrics… :-)
Having tracing also enables Datadog Service Maps, an automatically built map of interconnections between various machines and services. On the infrastructure Datadog demoed the map on, the complete map was too busy to understand, but the deep-dives (focusing on a single service) were well presented. I think there will continue to be a space for manually drawn, high-level system architecture maps, but I can certainly see low-level (subsystem or individual service’s connections) hand-maintained maps going away soon as more and more services emerge offering similar relationship discovery functionality.
For metrics, the new global distribution feature could help with some of the issues we experienced when performing calculations across multiple timeseries. It would be great if specific (arbitrary) values some of our engineers are asking for were available, but the feature only supports a short, fixed list of percentile values. Metrics also got enhanced with a Watchdog feature that automatically highlights and alerts on outliers.
Among the numerous Datadog Directors of Engineering covering the various features, several Datadog clients made an appearance too. The most memorable big idea came from James Turnbull: as monitoring of system metrics changes to focusing on outcomes (business related product metrics), monitoring tools are evolving into tools for understanding that can be used by a diverse customer base inside a company, not just by engineers on call. Information captured by these systems should be explicitly designed for that (design for observability).
Surviving Blockbuster Releases at EA—Johan Mjönes
“Kubernetes is winning because of the amount of operational expertise available as code, for free. One can’t hire enough talented SREs to duplicate that.”
The talk covered the architecture of EA’s server side support of their triple-A games, with many components not being particularly special to the gaming world (standard identity and commerce solutions; analytics and telemetry; Mesos/Aurora based container schedulers and Scala/Finagle microservices for custom services). Some examples of game-specific services would be matchmaking and leaderboards. Mesos/Aurora is a five year old architecture decision and today Johan would just use Kubernetes.
Load testing was a major part of the talk and EA does it a lot. They cannot test small increments in production because of “big bang” usage pattern of major game releases. Locust is an open-source load generation tool used at EA. Cloud, in general, is a great fit for EA because of the need for immense capacity for a few weeks following a big launch. People who build and operate services work closer together in cloud infrastructure as well, compared to owned infrastructure.
Summary: pre-launch events. load tests. resilient systems. overcapacity. observability.
Journey To A Service-Oriented Architecture At 1,000-Engineer Scale—Tiffany Low, Willie Yao
Tiffany and Willie shared the story of two attempts (an aborted 2012 one, and an ongoing one) to transition from a Ruby on Rails monolith (“monorail” in AirBnB-speak) to a microservice architecture. For AirBnB, the biggest reasons to leave the monorail were deploy contention and unclear code ownership on shared pages. With hindsight, most SOA challenges at AirB&B ended up being organizational, not technical, in nature.
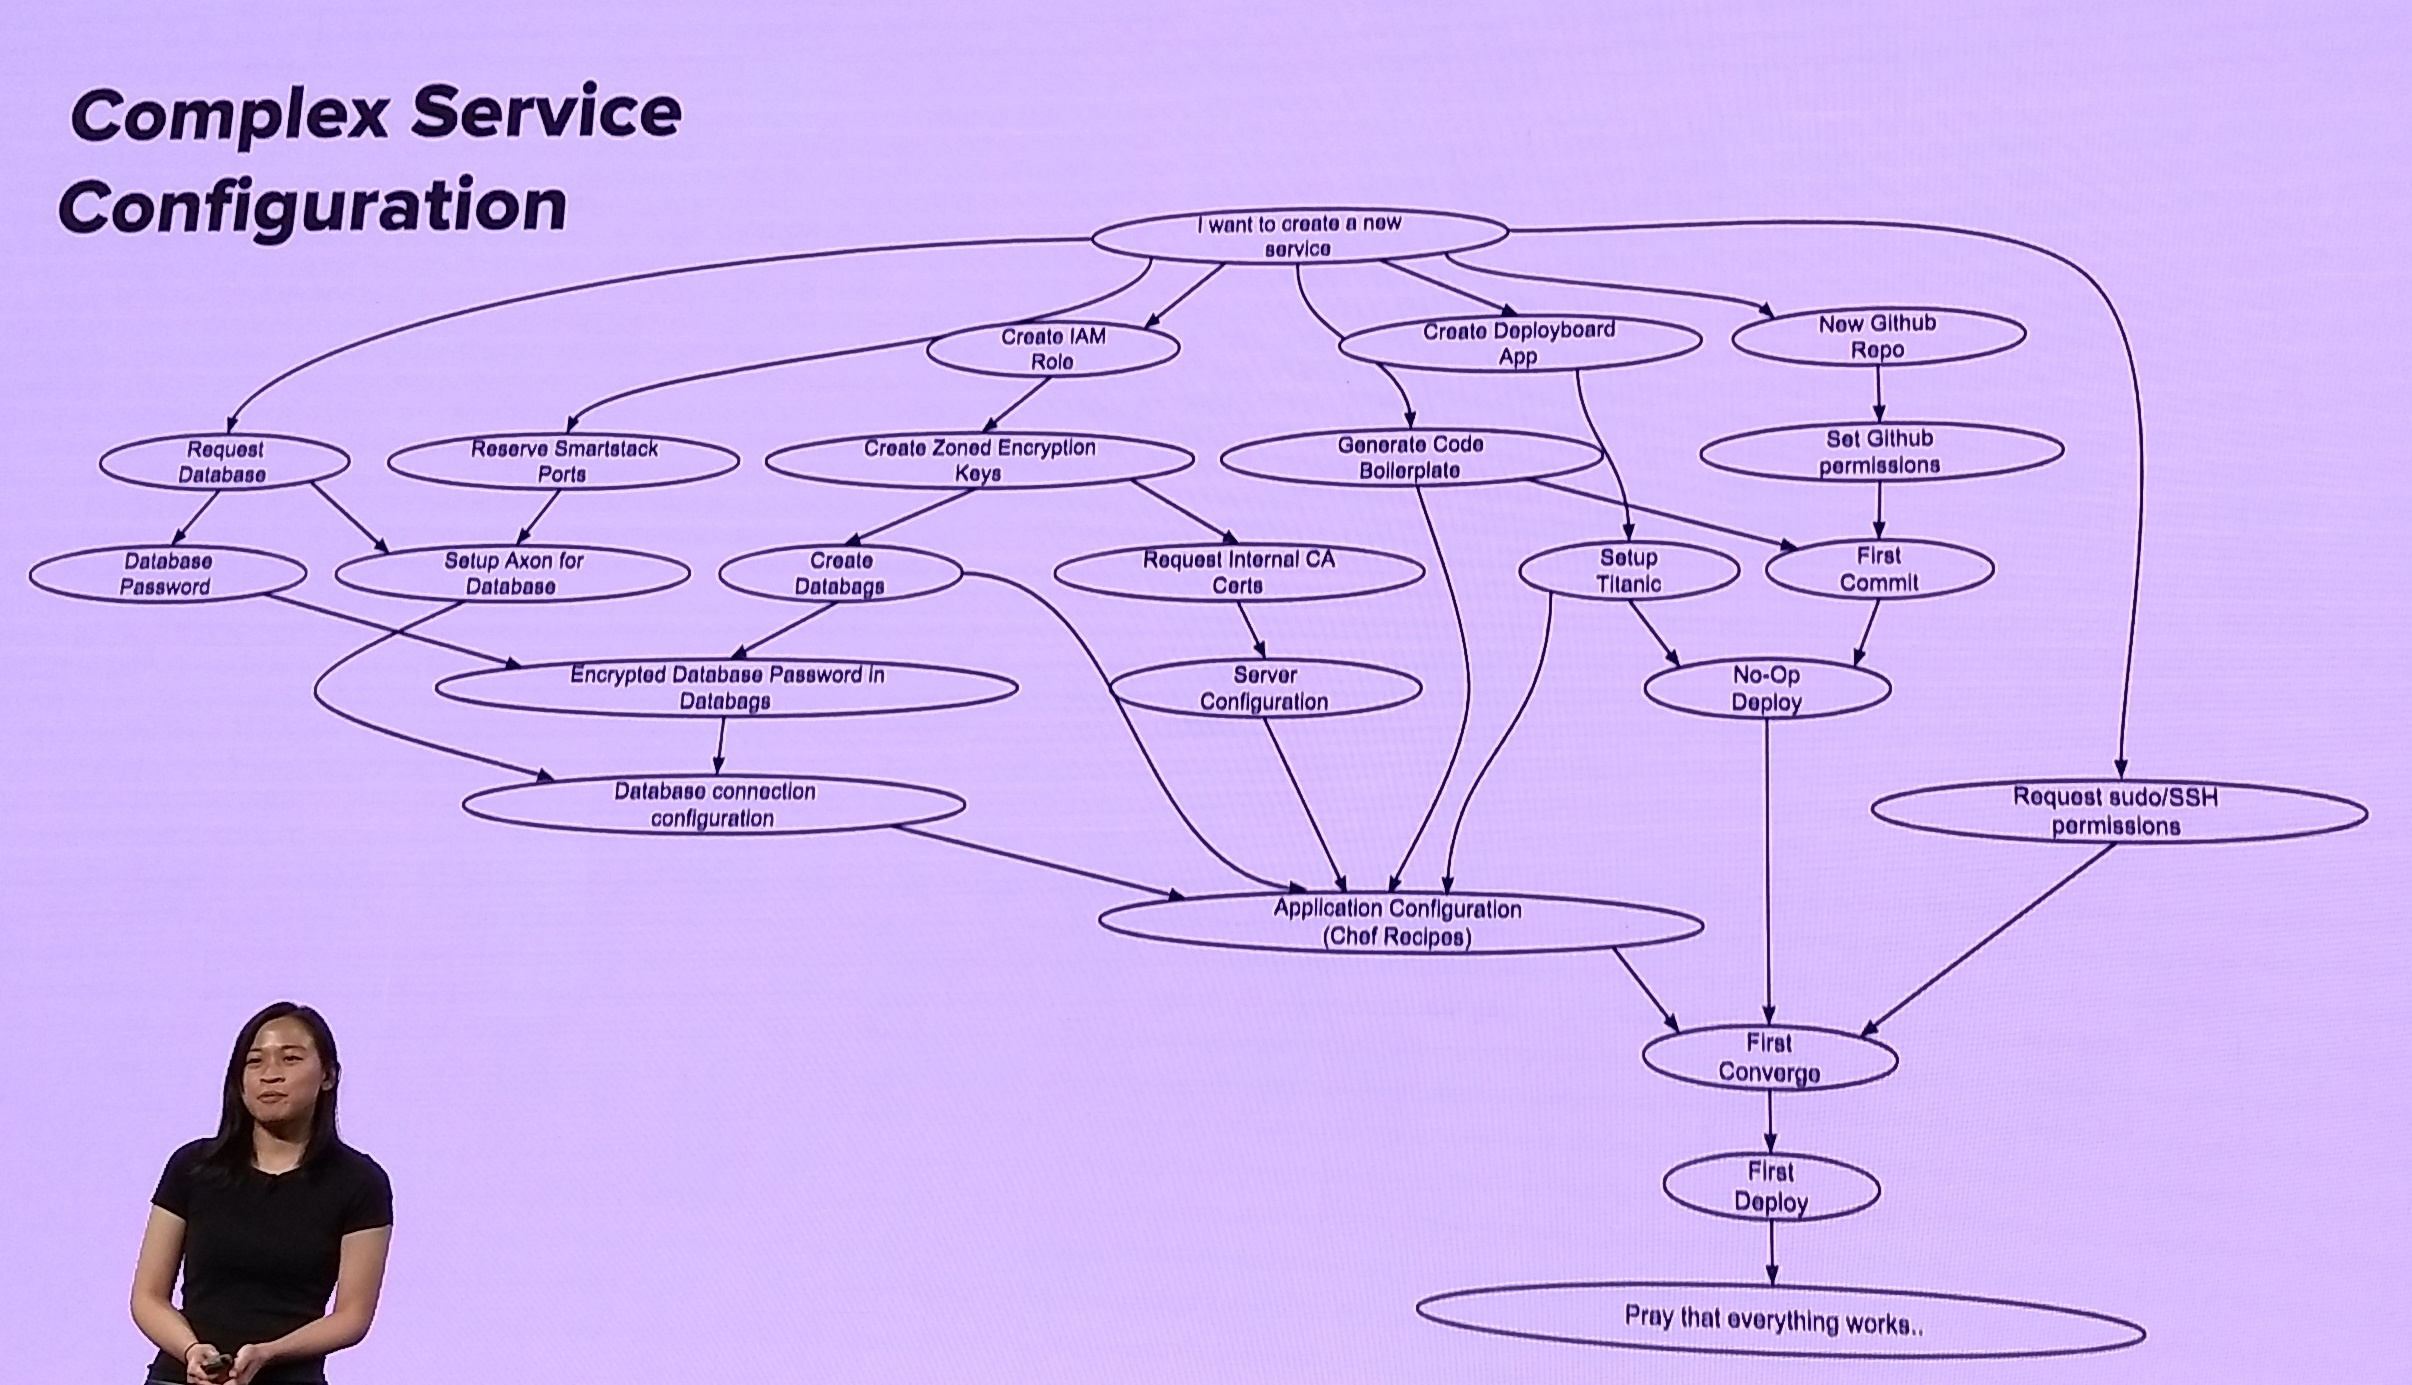
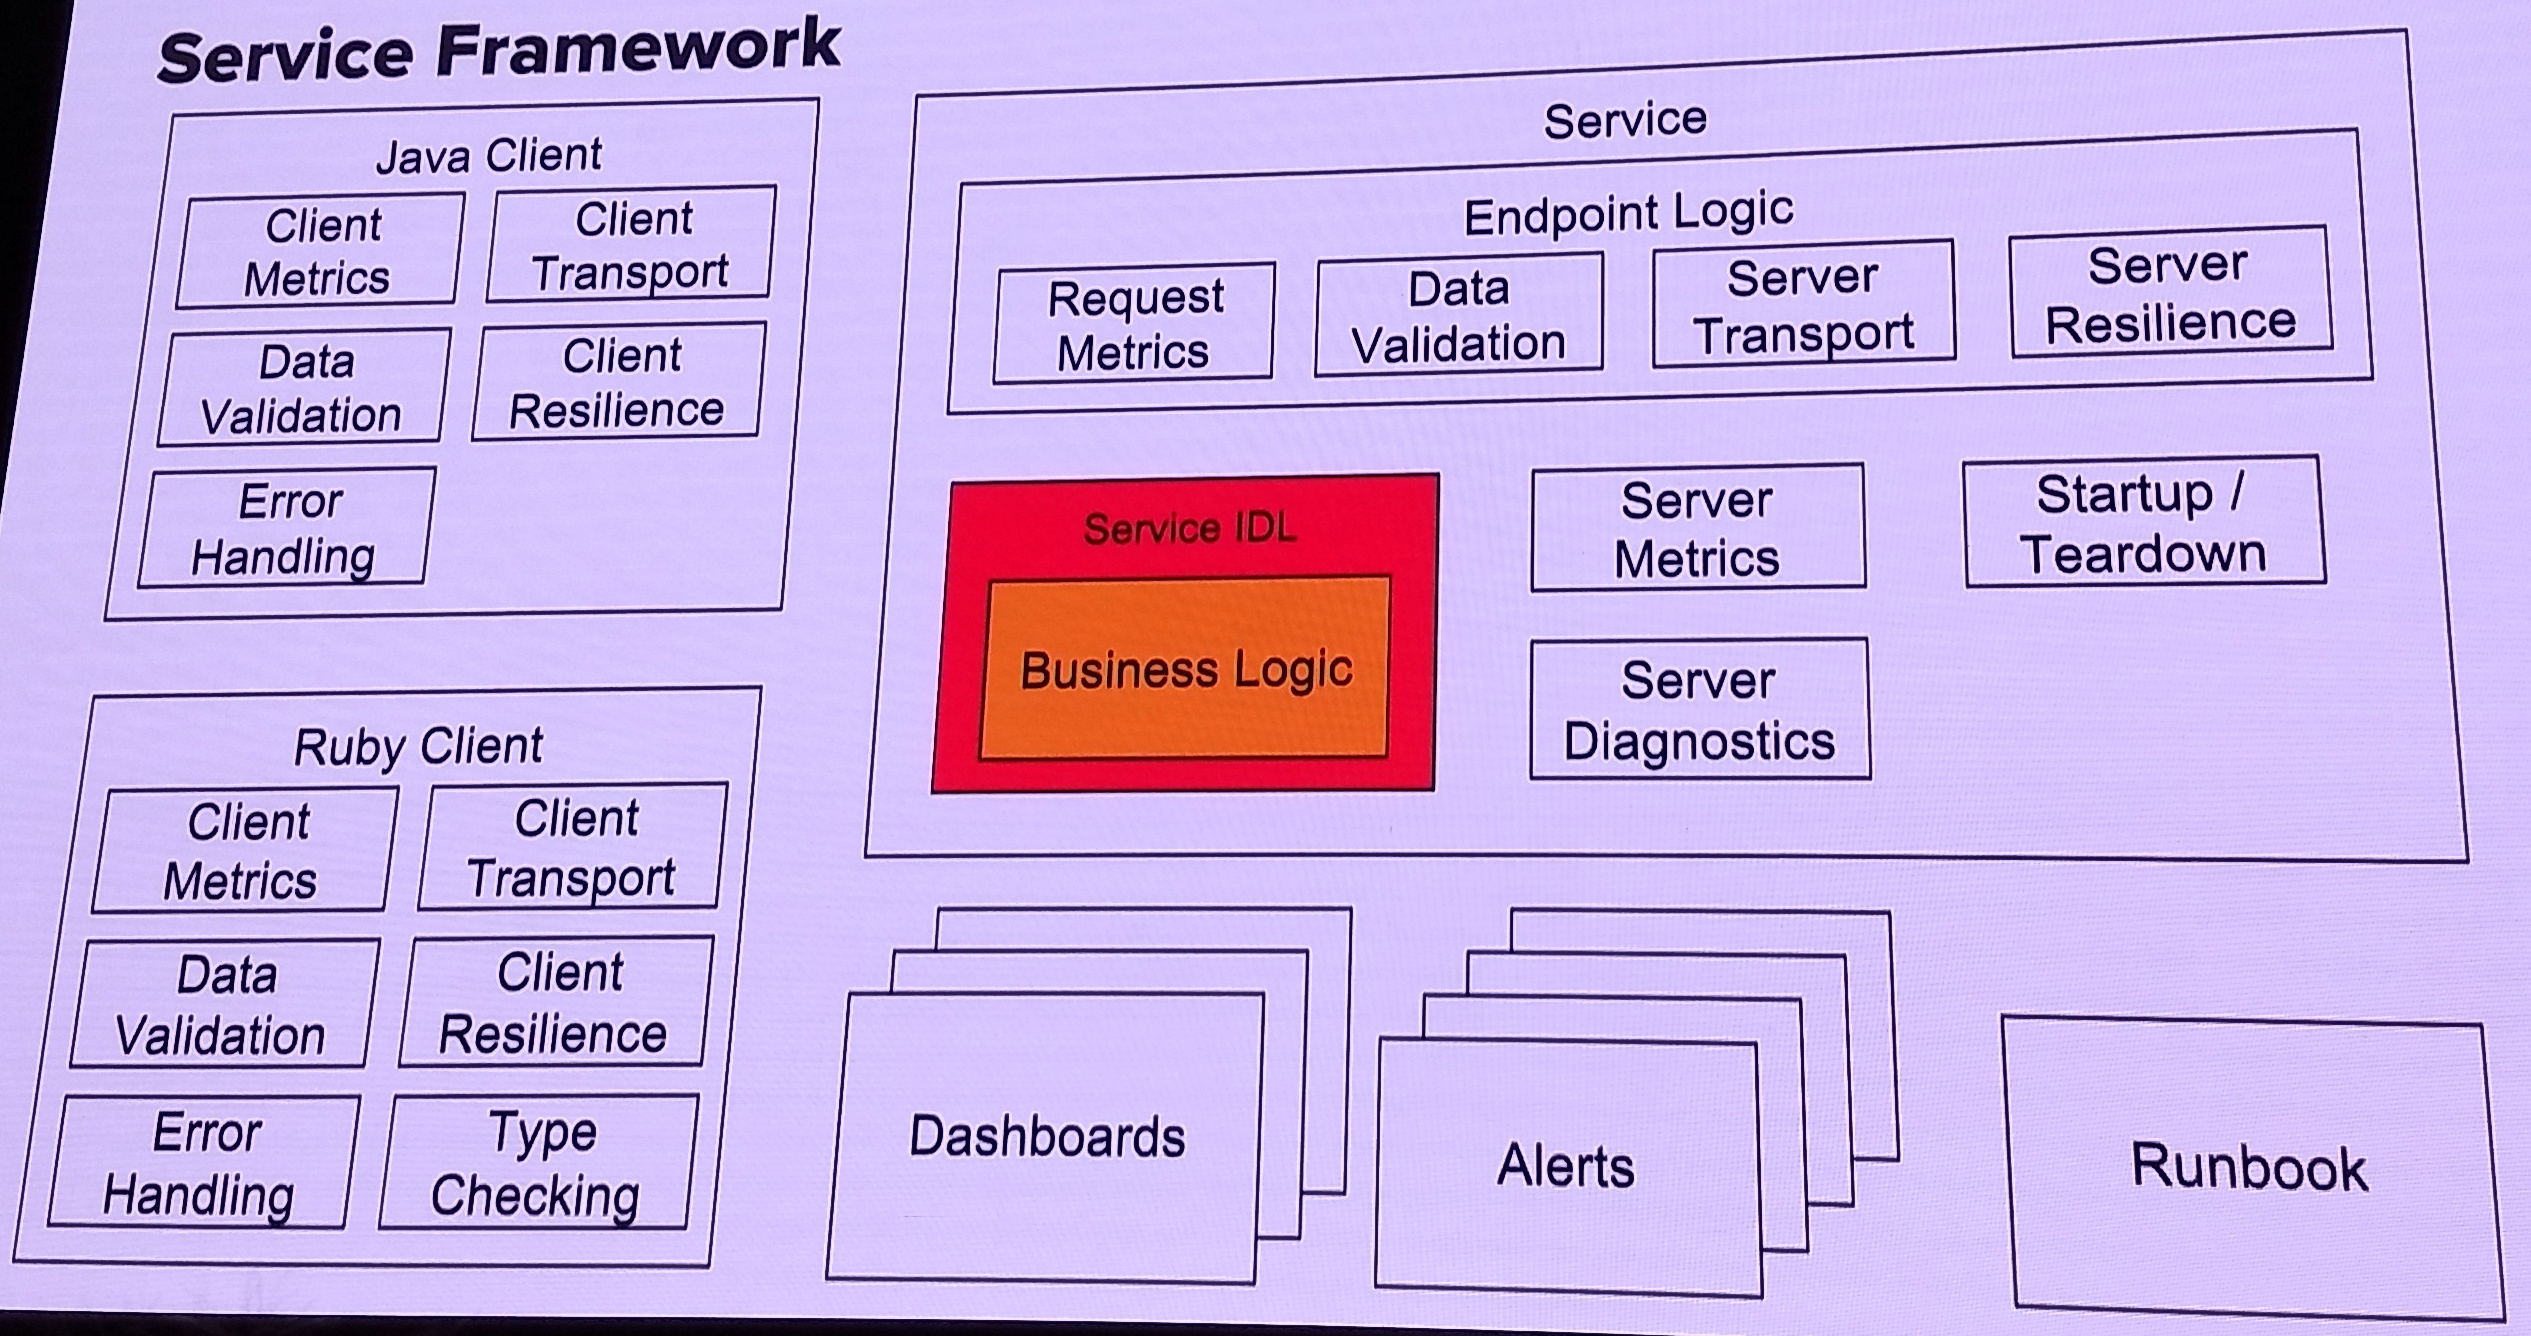
The first attempt to break out services started in 2012. The first hurdle was needing circuit breaking for any network calls - a smart HTTP client. They developed one and it became a standard internal library. (Unfortunately, I dind’t take notes on exactly why the first attempt failed). Here’s what a complex service bring-up workflow and framework look like:
For the second migration attempt, they chose a complex page (listing details page, jointly owned by 16 teams) to serve as a hero model. Developed a service boilerplate: code, monitoring, runbooks, which together became a “template for success”. Good documentation and a launch of SOA as a product helped drive adoption.
The anticipated project timeline is two and a half years:
- 2017 realigned on goals.
- Mid-2017 staffed up.
- Early 2018, migrated the listings page.
- Mid-2019, proposed feature freeze on the monorail.
Results so far: 115 minutes shipping time for a monorail commit, 4 minutes for a microservice commit. Better metrics. Fixed an issue of 30% of bugs not being addressed within SLA (it takes too long to fix bugs).
Many fast growing companies run into a technical debt problem; Amazon, LinkedIn, Facebook. To succeed in a complex infra migration, investment into infra needs to be translated into business needs.
Short notes
Nick Vecellio talked about the need for making decisions quickly in a retail-style business like Wayfair, where data needs to be available close to real time. This is facilitated by “simple, fast, stupid and easy” systems; pipelines instead of complex flow charts; Logstash-ElasticSearch-Kibana in most of the examples and using standard components.
Rob Desjarlais gave a number of tips on monitoring busy systems, focusing around CPU and disk usage. A shared theme was many Linux default settings not being optimized for high-volume production use, and old tools not reflecting the state of modern systems accurately.
Specifically, potentially misleading data from vmstat (only collects input from the floating point execution unit. Most apps today do not use it, and work the Load Store unit instead. Utilization can be low but there would be tons of threads waiting for CPU time), bad behavior associated with swap space (swapping out when unnecessary), very short disk I/O queues by default. A lot of the tools Rob mentioned can be found in Brendan Gregg’s performance related tool collection.
The Istio on Kubernetes workshop was an interesting whirlwind tour of the system, but (like with any complex software) the pace of the tour left very little time to actually understand the details about what was being done besides repeating the commands. It would take a lot more time to learn the ins and outs of this service mesh solution. The workshop ran on the IBM cloud, and it took about 25 minutes to provision a Kubernetes cluster with a single worker on it.
Here’s the view from the roof of Spring Studios, as a reward for getting to the end :)